QSR Seating: Which Chair Type Maximises Seats Per Square Metre?
- Share
- publisher
- Lisa Liang
- Issue Time
- Nov 19,2026
Summary
A density comparison of QSR seating types: seats per square metre for chairs, benches, stools and booths, and how seating choice changes labour and cleaning cost.
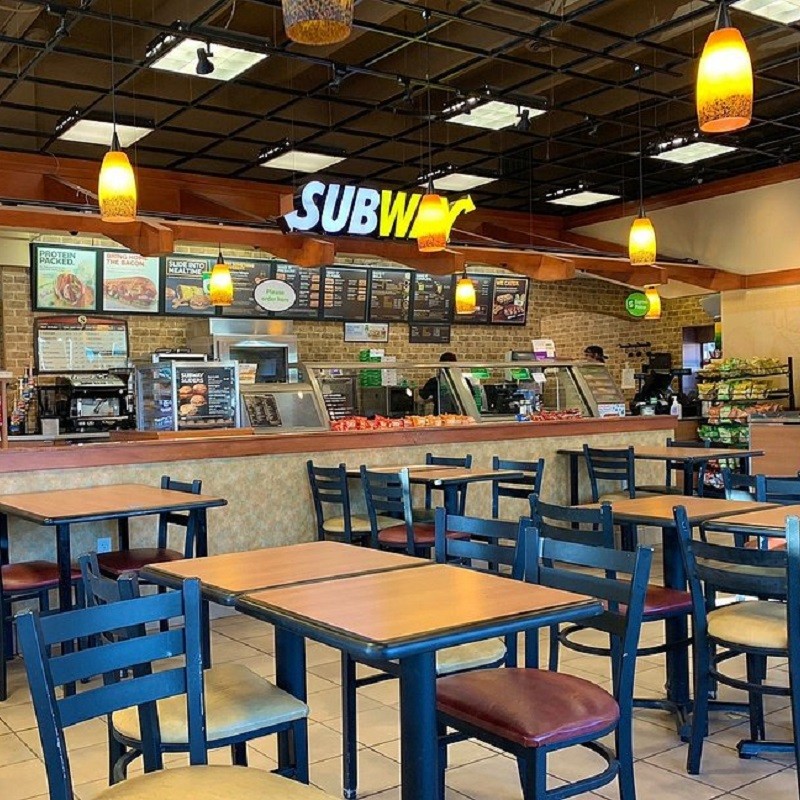
Quick Answer: Which QSR Seating Type Packs the Most Seats?
Bench and banquette seating delivers the highest seat density in a QSR, typically 2.2–2.6 seats per square metre of seating area, against 1.4–1.8 for loose two-seat tables and 1.9–2.2 for bar counters. The ranking is not a recommendation on its own: a bench that packs 2.4 seats per square metre but stops solo diners from sitting in it can deliver fewer usable seats than a looser layout. Density has to be measured in usable seats at peak, not in theoretical positions.
For specification questions beyond the scope of this article, see the CDG FAQ library.
The capacity pressure behind that question is real. Deloitte's Foodservice Market Monitor 2026 records QSR at 33% of a EUR 2,981 billion global foodservice market in 2025, with QSR growing at a 4.6% CAGR over 2019–2025 while full-service restaurants managed 0.8%. Volume growth of that kind lands on fixed footprints, which is why operators now treat seats per square metre as a revenue metric rather than a design preference.
The three jobs QSR seating has to do
Every seat in a fast food unit performs three jobs at once: it has to hold a customer for 12–18 minutes comfortably enough to prevent complaints, it has to be cleanable in under 40 seconds between guests, and it has to signal the brand's positioning to someone deciding whether to come in. Seating that fails any one of the three costs money, and the cost usually appears in a different line of the P&L than the one that bought it.
| Seating type | Typical seats per m² | Seat width | Cleaning time per seat | Best fit |
|---|---|---|---|---|
| Loose chairs, two-seat tables | 1.4–1.8 | 450–500 mm | 40–60 s | Flexible formats, mixed traffic |
| Loose chairs, four-seat tables | 1.6–1.9 | 450–500 mm | 50–70 s | Family and group traffic |
| Bench or banquette | 2.2–2.6 | 500–550 mm per place | 60–90 s | Dense urban and mall units |
| Bar counter with stools | 1.9–2.2 | 400–450 mm | 20–30 s | Solo diners, quick stops |
| High-top with stools | 1.7–2.0 | 400–450 mm | 20–30 s | Window zones, standing trade |
| Booth modules | 1.8–2.1 | 1,200–1,400 mm per module | 90–120 s | Brand-led interiors |
Table 1. Seat density by seating type, measured on seating area only.
Three checks worth taking from this guide
- 01 qsr seating
What QSR Seating Has to Deliver in Under 15 Minutes
Short dwell changes the ergonomic brief. A chair designed for a 90-minute dinner optimises lumbar support and seat depth; a chair designed for a 15-minute fast food meal optimises entry and exit, cleaning access and durability. That is why the best QSR chairs often feel slightly firm and slightly upright: they are engineered to be sat in briefly, wiped quickly and stacked easily, not to hold someone for an evening.
The measurable version of that brief is a seat height of 430–450 mm, a seat depth of 400–430 mm, a back angle of about 100 degrees and a seat width of 450–500 mm. Anything deeper than 430 mm pushes shorter diners forward onto the edge of the seat, which is where upholstery fails first.
Chair Types Ranked by Seats per Square Metre
The density ranking matters most in leased urban space, where rent is the dominant fixed cost. The same 40 square metres of seating area can hold 56 seats as bench, 68 seats as loose two-seat tables, or 88 seats as bar counter. The differences come from two variables: how much floor each seat occupies, and how much clearance the seating type demands around it.
Stackable chairs, benches, stools and booths
Stackable chairs are the most flexible and the least dense. Their advantage is that 150 chairs can become 90 seats at close and 130 at lunch, which is a capacity decision that fixed seating cannot make. Benches win on density but lose on flexibility and on cleaning access, since staff must reach across a fixed seat to wipe a table. Stools win on both density and cleaning time but cap dwell time, so they suit zones where the operator wants quick turnover. Booths win on brand perception and lose on density and cleaning time.
A useful way to hold the trade-off is to score each type against four criteria: usable seats at peak, cleaning seconds per seat, reconfiguration ability and brand signal. Very few formats score well on all four, which is why every mature QSR estate runs a mix rather than a single chair.
Fixed Versus Flexible QSR Seating
Direct Answer: Fixed seating maximises density and minimises movement, flexible seating maximises reconfiguration and minimises damage. The decision point is daypart variance: if peak and off-peak demand differ by less than 25%, fixed seating is usually right; if they differ by more, flexible seating pays for itself in labour and capacity.
Fixed booths and benches also remove a hidden cost that rarely appears in the furniture budget: chair theft, chair migration between zones and the labour of re-stacking at close. In mall units with shared circulation, loose chairs drift. In a 24-hour highway service area, they are dragged into the car park. Neither problem exists with fixed seating, and both are expensive to police.
Seating Mix by Daypart: Breakfast, Lunch and Late Night
A breakfast-led unit needs fast seats and a high proportion of two-tops, because most breakfast traffic is solo or paired and dwell is short. A lunch-led urban unit needs a bench-heavy central zone for peak absorption plus a bar counter for solo diners. An evening-led fast casual unit needs four-seat and booth capacity, because groups arrive and dwell extends to 35–45 minutes.
The mix can be expressed as percentages of total seats: 50–60% two-seat, 25–35% four-seat, 10–15% bar or high-top, and a booth allocation of 10–20% for brand-led formats. Operators who try to serve all three dayparts from one mix usually end up with a layout that is mediocre at each, and the fix is usually a reconfigurable central zone rather than a new chair.
Calculating Seats per Square Metre for Your QSR
Start with usable seating area, not total floor area. Subtract the queue zone, the circulation spine, the counter frontage, the tray return and any back-of-house spill. In a typical 120 square metre fast food unit, usable seating area is often 55–65 square metres, which is where most naive calculations go wrong: dividing 120 by a seat width produces a number that cannot be built.
Then apply the density factor for the chosen type and subtract clearance. The reliable formula is usable seating area multiplied by the density factor for the type, then reduced by 8–12% for circulation gaps and accessibility provisions. A 60 square metre seating area at 1.6 seats per square metre, less 10%, yields about 86 seats — and that number, not the theoretical maximum, is what belongs in the feasibility model.
How Seating Choice Changes Labour and Cleaning Cost
Cleaning time per seat is the least discussed and most expensive variable in seating selection. At 40 seconds per loose chair and 90 seconds per booth module, a 100-seat unit running four turns a day spends roughly 4.4 labour hours on chair cleaning daily with loose seating, and closer to 6.5 hours with a booth-heavy layout. Over 300 trading days that is a difference of more than 600 labour hours a year from a furniture decision.
Stackability adds a second saving at close: 150 chairs stacked in 15 minutes versus 150 chairs moved and aligned individually. The labour line in a fast food P&L is usually the second-largest cost after rent, which is why operators who model total cost of ownership rather than unit price tend to end up with a mixed layout: dense benches where traffic is predictable, loose stackable chairs where it is not.
If the layout covers several zones, the indoor bar stools, commercial lounge seating and restaurant booths pages give the matching dimensions, substrate options and container quantities for each configuration.
Let's Model Your Seat Density
Send us the floor plan and your daypart sales pattern. We will return a seat density model for three layout options — bench-led, loose-led and mixed — with seats per square metre, cleaning seconds per seat, reconfiguration time and a per-seat cost for each. If the plan is still at concept stage, we can work from the usable area calculation alone and show you what each option does to capacity before any model is chosen.
Contact: lisaliang@cdgfurn.com | +86 139 2610 3331 (WhatsApp / WeChat) | Export office +86 20 3693 3270 | Inquiry form and contact page on cdgfurn.com.
Continue with the inquiry form, the contact page, the restaurant furniture catalog and the CDG Blog.
Answer-First Reference: Seats, Density and Labour
qsr seating is specified against measured duty cycles, documented material performance and a repeatable after-sales programme. The figures in this guide are working ranges used in pre-order reviews; confirm every threshold against the project brief and the purchase order before a deposit is paid.
How many seats per square metre should a fast food restaurant plan for?
Plan on usable seating area rather than total floor area, and use 1.4–1.8 seats per square metre for loose two-seat tables, 2.2–2.6 for bench and banquette seating, and 1.9–2.2 for bar counters. Reduce the result by 8–12% for circulation, accessibility and tray clearance. A figure above 2.6 across a whole unit almost always means the plan has no queue zone.
Is bench seating better than chairs for a QSR?
Bench is better on density, on brand signal and on chair-drift control. Chairs are better on flexibility, on cleaning access and on solo-diner acceptance. The operational answer for most urban units is a bench core with a loose-chair perimeter, so peak capacity is absorbed centrally while the edge of the layout stays adaptable.
Does seating choice affect cleaning labour?
Yes, materially. Loose chairs take roughly 40–60 seconds each to clean and reposition; booth modules take 90–120 seconds because staff reach across fixed seats. At 100 seats and four turns a day the difference is several hundred labour hours a year, which usually exceeds the price difference between the two furniture packages.